
Site Analysis
Agency
The
Essentially, all models are wrong, but some are useful.
George Box, 1987, Empirical Model-Building and Response Surfaces, p. 74
inspired by Diana Alvarez Martin and Vahid Moosavi -" Inverting normative city theories and computational urban models"
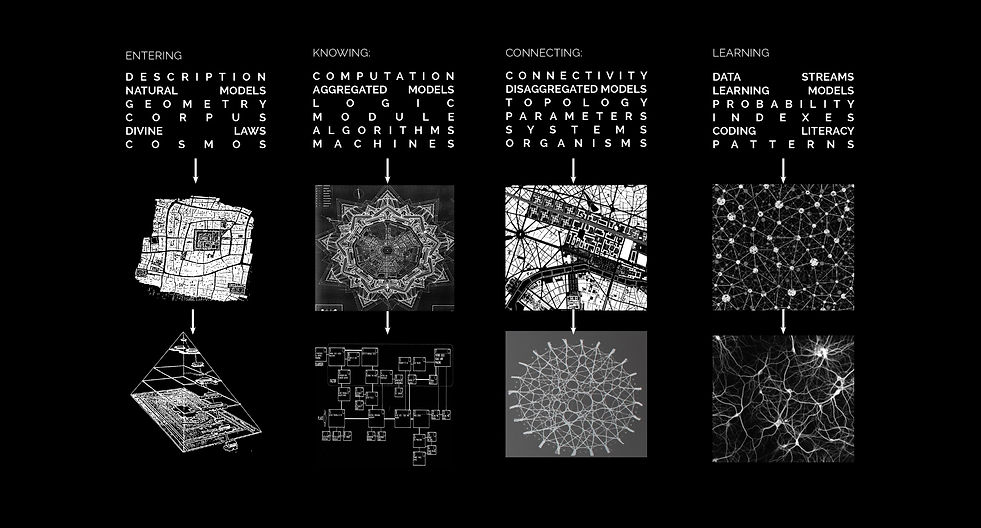
A city is a complex, aggregative, emergent system that paradoxically finds resilience through instability. Our culture is on a constant pursuit to try and arrive at some basic essence; be it Kevin Lynch’s Normative City Theory (Lynch, 1984), Cedric Price’s Egg Diagrams (Shane, 2005), or Spiro Kostof’s Three-City Models (Kostof, 1991) - just to name some modern attempts.
Such simplified models* can achieve moderate success in describing past realities. However, Architecture as a practice, in contrast to discipline, is not descriptive. Architects deal with design, coming from the Latin "disegnare" meaning (to) mark out, point out; devise; choose, designate, appoint. All present actions dealing with future affairs. Hence, "design" is a predictive or prescriptive process. And yet, most Architects treat site-models as a static condition to be represented. This preliminary decision has a great impact on the built involvement: since an architectural model is a form of interface, by its way of processing information it re-structures extrinsic content to fit its medium, activating a topological loop that in the end informs reality. And yet, we can not avoid data manipulation altogether because information and data are not one and the same. The information has to be excavated from data, then cleansed, treated, deciphered, articulated, and represented. There is no information without visualization.
*according to Roman Frigg and Stephen Hartmann, there exist the following types of models: Probing models, phenomenological models, computational models,
developmental models, explanatory models, impoverished models, testing models, idealized models, theoretical models, scale models, heuristic models, caricature models, didactic models, fantasy models, toy models, imaginary models, mathematical models, substitute models, iconic models, formal models,
analog models and instrumental models are but some of the notions that are used to categorize models.
Idealization
"What a useful thing a pocket-map is!" I remarked.
"That's another thing we've learned from your Nation," said Mein Herr, "map-making. But we've carried it much further than you. What do you consider the largest map that would be really useful?"
"About six inches to the mile."
"Only six inches!" exclaimed Mein Herr. "We very soon got to six yards to the mile. Then we tried a hundred yards to the mile. And then came the grandest idea of all ! We actually made a map of the country, on the scale of a mile to the mile!"
"Have you used it much?" I enquired.
"It has never been spread out, yet," said Mein Herr: "the farmers objected: they said it would cover the whole country, and shut out the sunlight ! So we now use the country itself, as its own map, and I assure you it does nearly as well."
Lewis Carroll, 1895, Sylvie and Bruno Concluded, p. 169
In order to examine any complex system, we must resort to Idealization, which is an intended (over-)simplification in the representation of the target system. There are three common types of idealization (see Michael Weisberg, 2006, Three Kinds of Idealization, UPenn press): Galilean idealization, minimalist idealization, and multiple-models idealization.
The Galilean approach is a pragmatic one - in order to make a theory computationally tractable, one introduces controlled distortions in order to simplify them. It is commonly applied to economic models, for example, which that agents are rational maximizers, while we now know (at least since behavioral economics) that this is not the case. Galileo employed this strategy while deliberately modifying friction in motion models. He wrote:
"We are trying to investigate what would happen to moveables very diverse in weight, in a medium quite devoid of resistance, so that the whole difference of speed existing between these moveables would have to be referred to inequality of weight alone. … Since we lack such a space, let us (instead) observe what happens in the thinnest and least resistant media, comparing this with what happens in others less thin and more resistant.”
Galileo Galilei, 1967 (first ed. 1632), Dialogue Concerning the Two Chief World Systems, p.117.
Minimalist idealization is the practice of building the "lightest" models of real-world phenomena possible by considering only factors that define an essential character of the phenomenon or are certain to impact its occurrence.
Multiple-models idealization is the practice of building multiple related but incompatible models, each of which makes distinct claims about the nature and causal structure giving rise to a phenomenon. For example,when architects build a "circulation", "structural", or "envelope" model, they don't claim that the model represents the building fully (as it would if it were a Minimalist idealization). Instead, they look at the single model as deliberately capturing a single facet of the building, and the accumulation of models would give a more wholesome understanding.
Complexity
Ideas thus made up of several simple ones put together, I call Complex; such as are Beauty, Gratitude, a Man, an Army, the Universe.
John Locke, 1690, An Essay Concerning Human Understanding, Book II, chapter xii: Complex ideas
The word "complex" comes from the Latin verb plectō: to weave, entwine. This suggests that complex systems comprise of many simple parts are irreducibly entwined, and the field of complexity is itself an entwining of many different fields.
Important concepts in complexity theory are that dynamical systems – those subject to feedbacks – exist in three aggregate states or phases: chaos, stability, and complexity. In chaos, no discernable rules, structures, or even heuristics apply, such as in the business cycle or the stock market. In stability, the behavior is linear or can be modeled by polynomials, that is, the change is differentiable and solvable with differential equations, equilibrium theory, and optimization. Complexity, however, is marked by periods (time) or subregions (space) of both stability and chaos. A system can move from one aggregate behavior state to another (a phase change),
but each behavior type is robust (resilient) against perturbation to some degree
M. Mitchell Waldrop,1993, complexity: the emerging science at the edge of order and chaos, )
Granularity
The term granularity refers to the level of detail of the target system that a model captures. In architectural models, granularity is a key factor in the model's capacity to serve as a descriptive analysis tool but also for synthesis - that is a prescriptive modification of the modeled subject. Since Architects use models as a base for future planning, the choice of model granularity has implications beyond the performance of the model itself and impacts the target system (built environment).
Not FAQs.
Machine intelligence finds answers; Human intelligence finds questions.
Why:
Beyond client specifications, the generalized function / conceptual brief should be established as the best strategy to address the Functional Purpose (here - make cities more Sustainable, etc.). For that reason, it is important that the site model won't legitimize biased ideas but instead test the conceptual brief hypotheses.
When:
Looking at a completed building is much like looking at the stars. When we gaze into the night's sky we are doing that in a relative present, which is set light years later than that of the stars we are watching. In a much more modest, human, scale, buildings are fundamentally the same. Because of the lengthy duration it takes to execute the design, even while at the ribbon-cutting event we already witness an image that was formulated many years prior. Consequently, we should ask ourselves, long before the delivery of the building, when is the planning taking place. We don't mean "when" within the design process - we had already established that the site analysis should come after setting the means to achieve the functional purpose. "When" should be taken in the sense of the time when the data are we basing the site analysis on is set - Past / Present / Future. A traditional site analysis approach deals exclusively with a static sample of the present and a more or less robust set of past observations. This descriptive method sets the building to be irrelevant even before construction had begun. We opt instead for a prescriptive, dynamic, present sampling along with some limited future assumptions. We recognize that there are some predicaments to collaging different time snippets, indicating different levels of certainty, onto the same model. However, it is not a larger err than traditional approaches that give the past and static present (which is by definition merely closer past) equal importance.
How long?
The site analysis principal usage is during the briefing stage but it should be designed in a way to facilitate the verification or disapproval of early hypotheses in the conceptual design phase. A site analysis that isn't instrumental in the development of the design is redundant.
How:
Qualitative statements in the field of spatial planning should not attempt to offer a full model that encompasses the entirety of urban forms. It should rather orient towards the analysis of relations between singular and multiple elements of the built environment, such as relations between singular and district elements and vice versa. It would also relate to the quality of being ‘’alien’’ (as the quantity of information added to the city by building a new element), beyond al these, qualitative statements would attempt to describe planning as an internal activity, in the sense that plans are conceived and operated from within the urban system.
For that reason, we call for a shift from traditional modeling towards agent-based modeling (AMB).
Traditional modeling
Deterministic (one future)
Allocative (top-down)
Equation based formulas
Do not give explanations
Few parameters
Spatially coarse
Environment given
Agent-based modeling
Stochastic (multiple futures)
Aggregative (bottom-up)
Adaptive agents
Explanatory power
Many parameters
Spatially explicit
Environment created
A common fixed position model is Cellular Cutomata (CA). CA has four elements: (i) a grid of cells, each of which can assume a finite number of states; (ii) a neighborhood, over which a change operator applies, usually the Moore (8-cell) neighborhood surrounding a cell in the grid; (iii) a set of initial conditions, that is, an instance of the states for each and every cell in the system; and (iv) one or more rules, which when applied change the state of a cell-based on properties or states of the neighborhood cells. The model advances by applying the rules to every cell one at a time, then swapping the changed grid with the initial grid, and by repeating this procedure.
Normally in a CA model, the transitions take place from time t to time t+1 and would ideally simulate the physical states between time t=0 and t+1 (Batty and Jiang, 1999).
A common mobile position model is Agent Based Model. This term is confusing because CA's are in fact agents as well. But, that's currently the accepted terminology so we'll continue with ABM's as holding a double meaning.
An ABM consists of (i) agents specified at specific model scales (granularity)
and types; (ii) decision-making heuristics, often informed by censuses and surveys in the real world; (iii) learning or adaptive rules; (iv) a procedure for agent engagement, for example, sample, move, interact; and (v) an environment that can both influence and be impacted by the agents.
There exists a third way, which is the combination of fixed and mobile position models. In such a framework, the final transition rules of a CA would be derived from the interactions among different agents. Thus the agent-based model would operate on top of a CA layer where agents respond or initiate state transitions in the CA.
A basic distinction in ABM's is whether the agents can change their location or only change their state.
Macro
Processing big-data operations on a student grade lap-top computer pose a considerable challenge. The question is that of resolution which can be vulgarized through a simple analogy: the wider the screen, the more "pixels", and thus resources, are needed to keep a similar quality of detail. The issue is, as opposed to say an architectural drawing which is strictly representational, the information here gathered feeds directly into the process loop. And so, discarding information (like adding information) will inevitably change the process results. Furthermore, it is not retrievable. For that reason, it was of the utmost importance that we try to avoid culling data as much as possible.
We found that a sample grid of 40 meters by 40 m. gives us a light enough data set which could still retain a thick enough "grain" that could be used farther as we descended in grain sizes.


Micro
In order to make sure that our prediction of the mass in the site would be as accurate as possible, we choose to limit the interference area (aka project's "blue line") according to the statistical trend. As demonstrated on the left, we first select an Information layer (see Macro's) and a starting from the center of the site. Using the 40x40 sampling grid of the Macro scale, we expand the site boundary in all directions, one step at a time, according to one condition: does the next step continue the trend (stays unchanged, continues ascending or continues descending) or not. If there is a break in the trend, the expansion stops in that direction. As shown in the bottom video, once the process is completed, we arrive at a stain shaped boundary which is unique for each information layer gathered.
57 statistical trend boundary lines (one for each information layer) were geometrically averaged to result in a single unifying curve. Then we turned to see which building plots are found inside this "blue line": inside means potential development area while outside remains untouched.
In the model below, solid white signifies non-modifiable plots while opaque signifies modifiable.